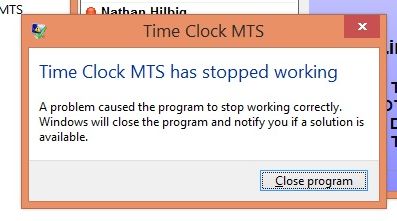
In late 2012 one of my software products started failing on start up on certain computers. The product is programmed in VB6 and uses a number of 3rd party controls. The concerning thing about it was that the product would run for months or even years on a computer and then one day, without warning, the software would start up, and display the dreaded “The Application has stopped working” message. I must confess that for a long time I believed the issue was a minor one, and probably caused by a conflict with an anti virus program or similar. I tended to (rather poorly) recommend rolling back Windows to an earlier point. As the months rolled by I saw the issue on Windows Vista, Windows 7 (32 and 64 bit) and Windows 8 and 8.1. Every 10 or 12 weeks I’d spend a day digging around on Google trying to get to the bottom of it with no luck. For three reasons, firstly I had no real idea what I was looking for so my searching was rather aimless. Secondly, I could never EVER ever reproduce the problem on any of the half dozen computers in my office, nor on innumerable VirtualBox machines. And finally, I never really paid the problem the attention it deserved, which is entirely my fault.
However, in the last month the issue seems to have become more common, with the occasional person reporting it in my software uninstall surveys, and long term users reporting the sudden failure of the software on their computers. Of course, if it was failing for trial users it was costing me money, but I couldn’t measure the loss so I ignored it. That changed in the last month when I had to give a number of refunds to users who bought software that suddenly stopped working. Ouch. So the bug was really starting to concern me and to be honest, I’d started losing sleep over it because I just couldn’t work out what was going on. I was even considering re-coding the entire product in C#, not a small task with 75,000+ LOC in the Visual Basic code. I’d be looking at 6 to 12 months to completion and then at least 6 months of quick release cycles to get the bugs ironed out. Not an exciting prospect and I’d still have the bug gnawing away at my sales while I was beavering away on the re-write. And I’ll be honest I didn’t want to move the application to .NET. I’ve ported a VB6 application to C# before, and while the coding structure was much nicer, the actual speed of the application was FAR worse than the VB6 app and I’ve had to resort to all sorts of caching chicanery to get the performance to what is a barely acceptable level.
Matters Come to a Head
Things came to a head yesterday, with two new people informing me of the error and it was looking like I’d have to refund both of them for purchases made in the last few months. I spent some time poking around on Google again yesterday and finally hit on something useful, how to create application crash logs. It turns out getting an application to create a crash dump is as simple as adding one new Windows registry key:
HKEY_LOCAL_MACHINESOFTWAREMicrosoftWindowsWindows Error ReportingLocalDumps
When the application fails it creates a dump file here:
%LOCALAPPDATA%CrashDumps
I tested this on my local dev machine by triggering an application failure and creating a dump file, which I then could open in VS 2010. I couldn’t make much sense of it though. All I needed now was a machine that was experiencing the crash to create a dump file for me and perhaps I could get to the bottom of things.
Along Comes a White Knight
I had the first glimmers of the possibility of getting to the bottom of this vexing issue last night, when a long time user of my product reported that he was experiencing the issue. Recently my usual approach has been to ask if I can get a short time to access the problem computer remotely using my remote access tool of choice, Teamviewer. Sometimes people say yes, sometimes they so no. In the case of this particular customer, he said sure you can have access, and I’ll leave it on ALL NIGHT for you so you can take as long as you like. HUZZAH!
Grabbing the Crash Dump
I logged into the customer’s PC remotely and ran my software. Sure enough, it crashed on startup. Interestingly when it crashed I saw a flash of the main application window before the troublesome error box appeared. I then tried starting up the software with the application window minimized, and hey presto it ran. But as soon as I activated the window the software crashed again. This confirmed what I’d already suspected, that the crash had something to do with the first redraw/paint of the application window. Examining the log files my software creates showed what it usually did, the software crashes somewhere AFTER the first form resize event. Anyway, I’d confirmed that the crash I was seeing was the same one other people had seen. Time to create the Windows Registry key I mentioned earlier to have the software create a crash dump. I did that, ran the software to crash, and looked in the %LOCALAPPDATA%CrashDumps folder and there was my crash dump. Transferring the file to my own computer I wondered what to do next.
WinDBG is King
I’d already opened up a crash log in VS2010 and to be honest it meant nothing to me. So I tooled about for a bit on Google and it appeared that the tool of choice was “WinDBG”. I found an installer for it on windbg.org. Once installed it fired up and I loaded up my crash log and was shown this:
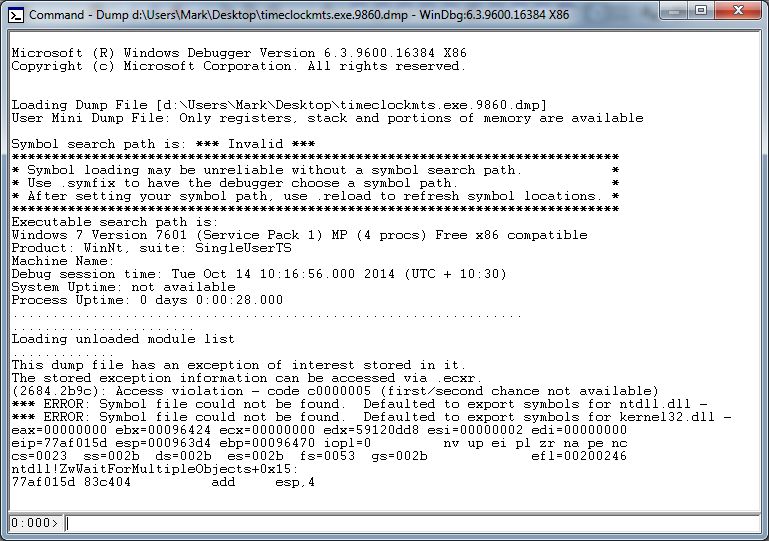
Crash Dump in WinDBG
All very interesting but it doesn’t tell me much and the reason is on the 5th line of text “Symbol search path: *** Invalid ***”. Now, time for full disclosure, I am no computer scientist and my programming coursework was confined to PASCAL and I have little idea of computer architecture and a computer stack to me, is just a pile of computers. So, when I saw this message I had no idea what a “Symbol” was and had even less idea how WinDBG was going to help me. 10 minutes of research later I’d worked out that Symbols are used to decode the crash dump (which is essentially a memory dump) and allow WinDBG to display various function calls and function sources associated with the dump. Giving the debugger a symbol path is simple, just run the following command in WinDBG:
.sympath SRV*f:localsymbols*http://msdl.microsoft.com/download/symbols
Once that was done I could analyze the dump file again with:
!analyze -v
The analysis took a minute or so and the first thing of interest that popped up was:
*** ERROR: Symbol file could not be found.  Defaulted to export symbols for ciaXPLabel30.ocx -
***** OS symbols are WRONG. Please fix symbols to do analysis.
ciaXPLabel30.ocx is a third party text label control used on the main form of the application. The same form that would partially re-draw before the fatal crash.
The actual call stack was many lines long, but basically was a repetitive loop that looked like this:
0009750c 72a09a7b msvbvm60!BASIC_DISPINTERFACE_GetTypeInfo+0x2aa
0009754c 72a09c2c msvbvm60!EVENT_SINK_Invoke+0x50
0009757c 758c370d oleaut32!CFontEventsCP::Notify+0x9f
000975d4 7589c30e oleaut32!CFont::DiscardFont+0x5d
000975e8 758c41e5 oleaut32!CFont::put_Size+0x76
000975fc 729932c4 msvbvm60!IID_IVbaHost+0x24c84
00097630 72973db1 msvbvm60!IID_IVbaHost+0x5771
00097684 729c1e19 msvbvm60!IID_IVbaHost+0x537d9
000976c0 729acdb0 msvbvm60!IID_IVbaHost+0x3e770
000976fc 729ad0a1 msvbvm60!IID_IVbaHost+0x3ea61
00097730 72980eed msvbvm60!IID_IVbaHost+0x128ad
00097990 4fbadfdb ciaxplabel30!DllCanUnloadNow+0x10efd
00097a28 4fbaa41a ciaxplabel30!DllCanUnloadNow+0xd33c
00097a64 75873e75 oleaut32!DispCallFunc+0x165
00097a80 72a16ef5 msvbvm60!_vbaAptOffset+0x68b
You’ll note in there that the ciaxplabel30 control has raised it’s head again. To my mind this was enough evidence to remove the label controls of that type from my form and replace them with vanilla Visual Basic 6 text labels. That took me about 20 minutes, I ran my automated build script and transferred the new executable file to my helpful user’s computer. And ran the application. And it ran. AND IT DIDN’T CRASH. So, two years of frustration and fruitless work followed by half a morning of focused effort and I’d fixed up my problem.
Where I Went Wrong
My main failing in this whole sorry saga was not paying the bug the attention it deserved. I dithered and procrastinated with it, and it wasn’t until it was costing me real money that I became truly motivated to solve it. Don’t get me wrong, I’d spent time looking into it but it was rather half-hearted. Shame on me.
Why I Went Wrong
There’s two main reasons outside of my control that contributed to the time taken to solve this problem. First, I work in a rather isolated fashion with no other programmers that I can bounce ideas off of. Add that to the fact that my technical understanding of crash dumps and dump analysis borders on non-existent and you have a situation that isn’t going to result in quick fixes. To remedy this in the future I’ll resolve to make better use of online resources like StackOverflow. If I’d asked a question there I am sure someone would have pointed me to the right path in short order. The second contributing factor was my inability to replicate the issue on one of my own dev computers. If could have done that I would have solved the problem through trial and error. Ipso facto, removing all the controls from the form one at a time until the application stopped crashing and solving the problem by trial and error.
Where I Went Right
I didn’t do any of this very well. I guess I did bumble onto the solution in the end but it took a long time and I was heavily reliant on a generous user of my software to do so. Without that help I wonder now if I would have ever gotten to the bottom of it all. Part of me doubts it.
Where to from Here
There’s an important new tool in my debugging arsenal now, and the next time (and I’m sure there’ll be a next time) I know were to start with application crashes. If I get stuck I will make better use of online resources and forums. And I will not sit on these problems and hope they resolve themselves.